As I was actively pondering that question, I had a flashback to 25 years prior when I was introduced to someone who told me that he was a freelance scientist.
My father had taught me that if I didn’t know what a thing was, I should just ask and not to worry about appearing stupid. He said that the stupid ones don’t ask for fear of looking stupid and so instead of just looking stupid, they stay stupid.
So I asked him what a freelance scientist does to fill in his work days.
He paused for a moment and studied my face.
He must have decided that the details would be lost on me (true) and so he gave me a “big picture” definition of a scientist, which is as follows:
“Being a scientist is like standing outside a sports stadium and being able to tell someone what the game is that’s being played inside, based simply on the crowd noise. And if he or she is a really good scientist, they can even tell you the final score.”
This, without ever seeing inside the stadium!
Bear that definition in mind because I’m going to swing back to it in a moment.
In the meantime, fast forward 25 years to me thinking how I could do better than only one in four webinar swaps hitting my “swipe right” sweet spot.
I didn’t know much about science, but I remember someone saying that numbers never lie.
So I hired three data-miners and they spent weeks feverishly collating dozens of metrics for each of the 155 webinar swap partners I’d worked with over the previous eleven years.
By “metrics”, I don’t mean some of the obvious numbers such as how many registrants each partner had generated or attendance rates (I already had that data) but rather numbers like the average “bounce” rate on their websites (that’s the number of people who hit their home page and then leave without exploring further), the average time someone spent on their website, the number of email opt-in offers on their website, the age of their website and a bunch more.
Surprisingly, this information is available if you are prepared to pay third parties for it.
Once my data-miners had all of the possible metrics for my previous webinar swap partners I spent hours computing, extrapolating, interpolating, correlating and generally going around faster and faster in ever-decreasing circles, trying to see if a mix of certain metrics could predict a certain level of webinar registrants.
Needless to say, I got nowhere.
I’ve often said that in order to be successful we only need to be smart enough to know how dumb we are.
And after weeks of mind-numbing computations and permutations, I had certainly convinced myself that I was data-dumb and that I needed help.
And that’s when I had the flashback about the definition of a scientist being able to identify the game played in a stadium and the score, without ever getting to look inside.
What if, I wondered, I could get a data scientist to figure out the likely “score” from the mass of metrics I’d accumulated, even before I started a “game” of webinar-swap?
In other words, could a data scientist figure out how many registrants a potential webinar swap partner was likely to generate for me, even before I approached them?
I decided it was worth continuing to tilt at this particular windmill, only this time with real scientists’ brains and not with my tiny little marketing brain.
So I hired two data scientists (it always pays to hire two of anyone so you can benchmark them and compare their results before selecting the best one) and I gave them both access to all the data from my long history of webinar swap partners, all the metrics my team of data-miners had mined, as well as access to specialist diagnostic platforms (all of this at a cost of over well over $3,500 a month – ouch!) and then I let them play with numbers for several months, checking in with them each week to review progress and talk about ongoing testing options.
BTW: I also gave each data scientist my “hunch” as to the metrics that I thought would correlate to certain registration numbers. For example, I figured that if someone had more email opt-in offers on their website and those offers were of high quality, then that would be one metric (number of high-quality email opt-ins) that would indicate a higher number of email subscribers associated with that website. Sadly, my hunches were completely useless ☹.
As mentioned, I hired two data scientists and set them loose to crunch and correlate.
Here’s a partial list of the metrics that they considered during their anally retentive activities:
1. Number of email opt-ins on website
2. Average duration of visits
3. Number of visits
4. Number of unique visits
5. Alexa ranking
6. Age of website
7. Organic keywords
8. Average visit duration
9. Average page visits
10. Bounce rate
11. Traffic percentages by source
12. Using PPC
13. Number of no-follow back links
14. Number of follow back links
15. Number of referring domains
16. Traffic by country
17. Blogger – yes or no
18. Podcaster – yes or no
19. Ahrefs ranking
20. SEM Rush ranking
21. Referring I.P.s (don’t ask, I have no idea)
22. Anchor teams (ditto – go find a geek and ask them)
23. Number of emails per week sent from domain URL
To cut a long story only a little bit shorter, one of the data scientists isolated seven of the above metrics that he thought were possibly, maybe, perhaps, indicative of email list size and therefore of the likely number of webinar registrants that a prospective partner may be able to generate.
But as the weeks went by, we realized that we were still way off in terms of the accuracy of our predictions and that we needed more than just those seven metrics.
That’s when the other data scientist had a masterstroke (by this stage I had them collaborate because I couldn’t figure out which one was better than the other).
Hold on to your hat because this gets hot and heavy…
Data scientist #2 applied a six month averaging formula to three of the seven metrics and then he further refined the results by eliminating any months that contained aberrations.
That immediately increased the accuracy of our predictive capability and our predictions were suddenly much closer to the mark.
But not close enough.
Both data scientists then agreed that some of the seven metrics were more consequential than others and so they gave each of them a "weighting" and produced a percentile score for each one and then they worked out an algorithm (a.k.a. “a bloody big formula thing”) that they applied to the seven percentiles and bingo … they/I/we hit the jackpot!
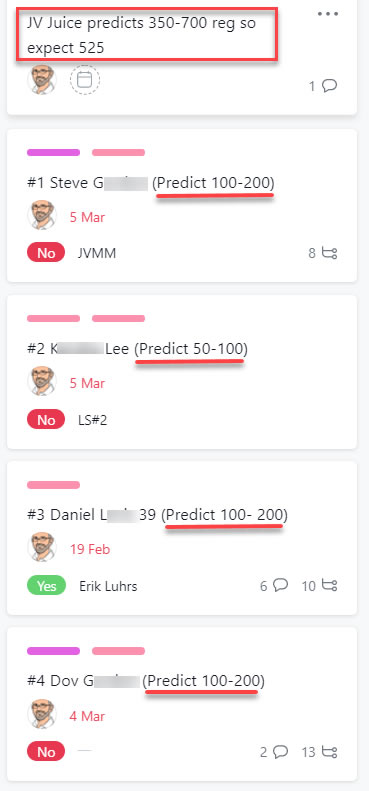
By working back from the 155 webinar swaps we’d done, and by applying the new algorithm to the seven winning metrics, we could/can/will/do predict to around a 75% degree of accuracy, whether a potential webinar swap partner will yield either:
a) 00 – 49 webinar registrants
b) 50 – 99 webinar registrants
c) 100 – 199 webinar registrants
d) 200 or more webinar registrants
Boom!
What this means for me is that I’ve gone from one in four webinars swaps hitting my sweet spot to three in four and we enjoy a significant jump in new client flows as a result.


 Sales Page for Leadsology Clients_files/unnamed(1).jpg)